- Drinking Water 2024 – Summary of the Chief Inspector’s report for drinking water in Wales
- Foreword
- Water supplies and testing
- Compliance with standards
- Learning from compliance failures
- Learning from events
- Consumer contacts
- Asset health
- Water safety planning and risk assessment
- Raw water
- Poly and perfluoroalkyl substances (PFAS)
- Audit programme
- Recommendations
- Enforcement
- SEMD
- NIS
- Materials in contact with drinking water (Regulation 31)
- Research publications
- Whistleblowers
- Working with stakeholders
- Annex A – Number of tests carried out by companies
- Annex B – Compliance with standards
- Annex C – Compliance failures and events
Compliance with standards
The percentage compliance with the standards in the Water Supply (Water Quality) Regulations 2018 (‘the Regulations’) is shown in Table 2 below.
Table 2. Percentage of samples meeting the standards
| Parameter Group | % Compliance |
|---|---|
| Chemical Parameters | 99.925 |
| Indicator Parameters | 99.979 |
| Microbiological Parameters | 99.980 |
| Overall | 99.971 |
| Pesticides | 100.00 |
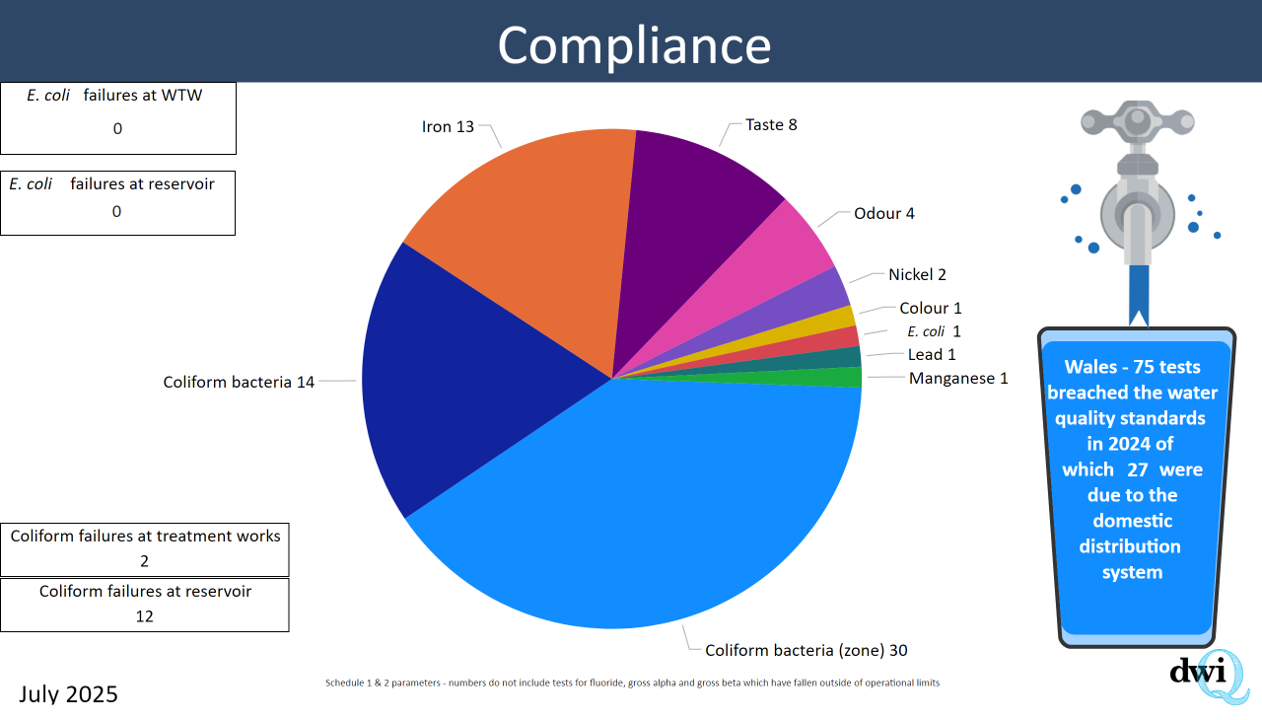
Infographic – Compliance with the standards in 2024
Table 3. Number of tests carried out by companies in Wales
| Company | Water treatment works | Service reservoirs | Consumer taps (zones) | Number of tests per company | Target number of tests |
|---|---|---|---|---|---|
| Albion Eco | 0 (0) | 0 (0) | 248 (1) | 248 | 248 |
| Hafren Dyfrdwy | 4,743 (6) | 15,472 (82) | 9,733 (25) | 29,948 | 29,949 |
| Dŵr Cymru Welsh Water | 67,522 (66) | 80,977 (328) | 88,327 (152) | 236,830 | 236,863 |
| Wales overall | 267,026 | 267,060 |
Compliance with the testing regime set out in the Regulations, which includes limit values for contaminants in drinking water, plus frequency and location requirements, remains consistently high in Wales. This end-point verification provides broad assurance that water supply processes are delivering water to consumers that meets regulatory requirements, at the point in time the sample is taken. Water company risk assessments however, detail risks that are not optimally controlled or mitigated, and these risks, when realised, will result in water quality impact. This water quality impact may result in a compliance failure or a water quality event, both of which the Inspectorate has used to establish indices to measure companies’ ability to remediate and prevent the recurrence of the realised risk. The Inspectorate uses the compliance risk index (CRI) to measure the impact of a compliance failure, and the potential consequence of those failures on consumers. CRI is designed primarily for the purposes of effective regulation ensuring appropriate scrutiny is directed to those areas of greatest relative risk. The chart below shows company compliance risk index performance.
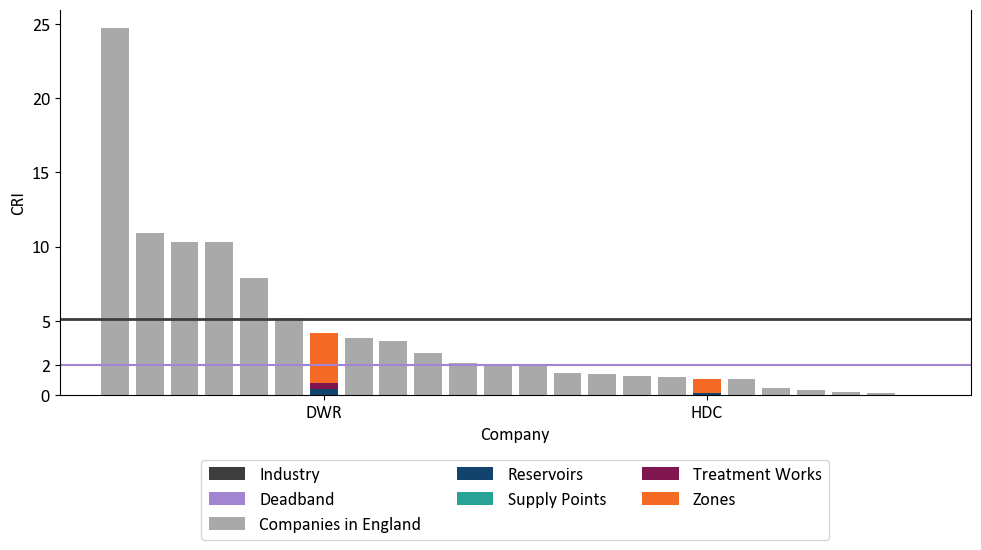
In 2024, CRI in Wales remains elevated in comparison to the wider industry, and there remains no discernible trend in the aggregate score. There therefore remains scope for significant improvement to strategic risk reduction approaches by Welsh companies. Targeting the largest contributors to this score would cause focus on failures at works including coliforms, turbidity, coliform failures at service reservoirs and taste and iron failures in zones. The three largest scoring compliance failures were a coliform detection at Dŵr Cymru Welsh Water’s Bretton works and taste and odour detections in Hafren Dyfrdwy’s Saltney zone. These three breaches accounted for 20% of the CRI for Wales. In 2024, Dŵr Cymru Welsh Water is the seventh highest scoring in the industry at 4.28 and Hafren Dyfrdwy sits in 18th place at 1.10.
In total in Wales, there were two coliform breaches at treatment works and 12 coliform breaches at service reservoirs in 2024, with 11 of these breaches covered by a Dŵr Cymru Welsh Water legal instrument, which increased the CRI accordingly. The maintenance, replacement, and enhancement of key assets are fundamental to driving improvements for Dŵr Cymru Welsh Water and must remain at the core of the company’s strategic business planning. However, asset strategy is a medium- to long-term initiative with financial interdependencies. As a result of this and the increased regulatory scrutiny that comes with the company being in transformation, the CRI in Wales is expected to remain elevated in the near future. This does not mean that the quality of drinking water in Wales is anything less than excellent. Rather, long-term strategic improvements are essential to securing the supply for future generations and mitigating future risks.
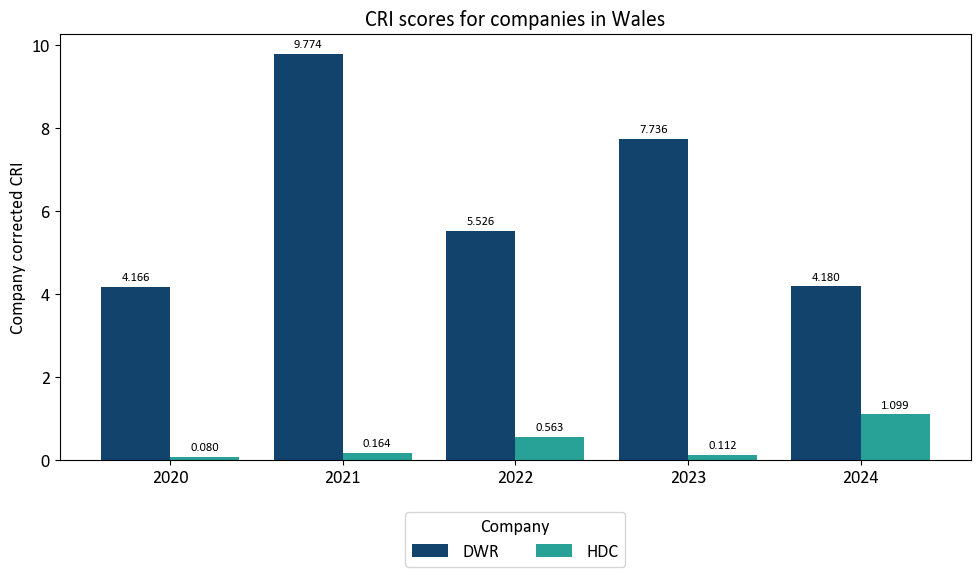
Figure 2 shows variability in CRI rather than any particular trend for both Dŵr Cymru Welsh Water and Hafren Dyfrdwy, since 2020.
Figure 3 shows the CRI for each company operating in England and Wales divided into site types; water treatment works, supply points, service reservoirs and zones (consumer taps).
The compliance risk index (CRI) is not a statutory measure and does not override a company’s duty to comply with each parametric value outlined in the Regulations. However, as a risk-based metric, its purpose is to direct companies’ resources toward the highest risks in a precautionary manner. The CRI is shared with the financial regulator, Ofwat, as a common performance measure within an integrated regulatory strategy aimed at enhancing water quality in the public interest. A CRI target of 2 has been established as the threshold for financial penalties, ensuring that outcomes remain both achievable and equitable when used as a water quality performance objective.
The median value for the industry in 2024 is 1.77 which is a decrease from 2.322 in 2023 then 1.365 in 2022 and 1.171 in 2021. The interpretation of the median CRI for the industry can be complex because it combines two-factors; the performance by companies, and the regulatory action by the Inspectorate since the issuing of notices in response to risk amplifies the measure. Dŵr Cymru Welsh Water remains in the top half of companies with a trend which reflects the ongoing strategic risks and the increase in regulatory action.
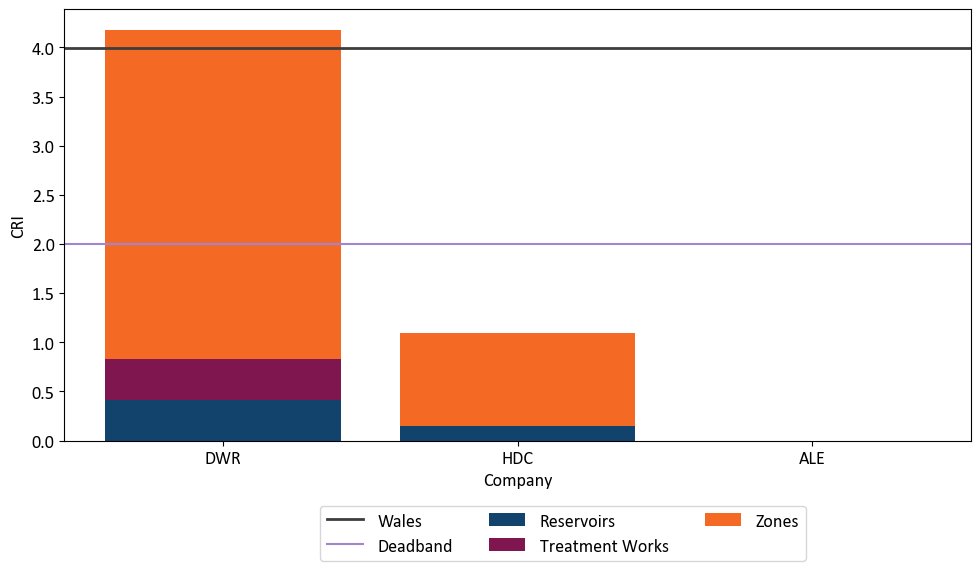
In 2024, the CRI for companies wholly or mainly in Wales was 4.08. This is an improvement from 2023 when the figure was 7.257, then in 2022, and 5.957 after improving on 9.173 from 2021 (Figure 2). The overall CRI figure is comprised of figures representing performance at different parts of the water supply chain (treatment works, supply points, service reservoirs and zones).
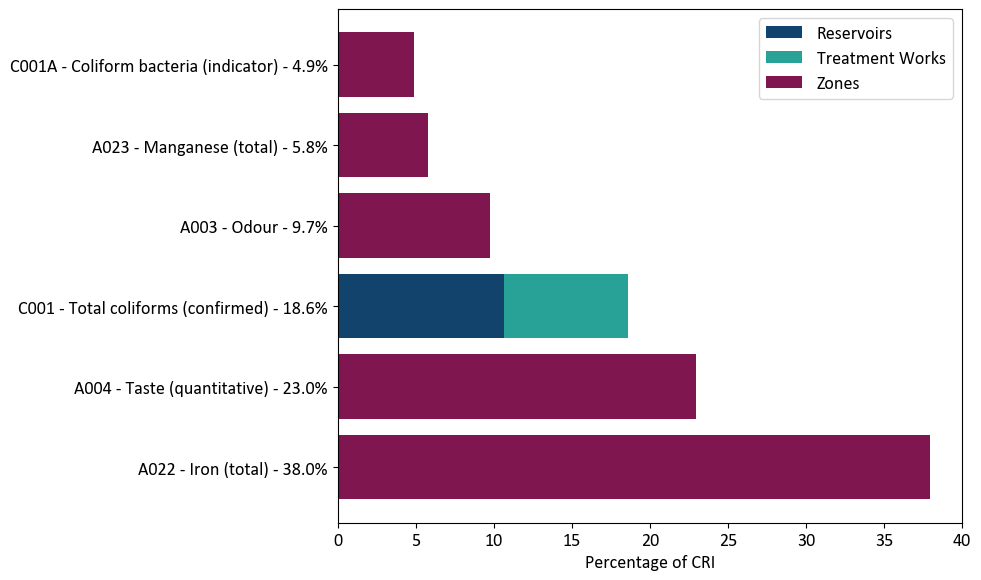
Considering individual company performance; there was deterioration in the CRI figure of Dŵr Cymru Welsh Water from, 5.397 in 2022 to 7.736 in 2023 with an improvement this year to 4.28. Hafren Dyfrdwy improved from 0.563 in 2022 to 0.112 in 2023 then deteriorated to 1.10 in 2024. Dŵr Cymru Welsh Water contributed to a significant proportion of the Wales CRI figure, and also exceeded the Welsh national CRI, 4.08. CRI permits the unpacking of the key contributors to each element within the score to understand where the risks are arising, and these can be seen in Figure 4. The data includes all regulatory failures, including Indicator parameters taken at treatment works, service reservoirs and consumer taps, and is used for the CRI calculation.
In Wales, breaches at large works supplying a high number of consumers continue to make up a large part of the CRI score for each year, with Bretton works in 2024, Felindre works in 2023, Ponsticill works in 2022, and Felindre works and Court Farm works in 2021. The consequence of non-compliance at large works is considered a higher risk by virtue of the number of consumers supplied. Coliforms are an indicator parameter which require action by the company as a precautionary measure to ensure the continuing protection of consumers. In the case of Bretton works, the company conducted a thorough investigation including a Water Supply (Water Fittings) Regulations 1999 inspection, treatment performance assessment and external tank inspection, however, as the contact tank is a single compartment, and can only be removed the next highest risk is not being able to take tanks of out supply for sufficient time to inspect, remediate and test before being brought back into supply.
Iron contributed to much less of the overall CRI score in 2024 at 7% compared with the previous year when it contributed to 33% of the score. However, for Dŵr Cymru Welsh Water, there were only two less failures in 2024 compared with the previous year, and 50% of the failing zones in 2024 had also failed in 2023. It is therefore not possible to conclude that benefits from short, medium and long-term strategies to mitigate and reduce these risks are being realised. Further detail on discolouration is included later in this report.
In total there were 14 microbiological breaches (no E. coli) at treatment works and service reservoirs in Wales in 2024. This is a decrease in detections from 2023 which saw 19 breaches. To maintain the high quality of Wales’ water supply, continuous risk identification is essential. Proactive measures such as tank removal and inspection, alongside regular maintenance and strategic investment, are strongly encouraged to ensure long-term sustainability.

