- Drinking Water 2024 – Summary of the Chief Inspector’s report for drinking water in Wales
- Foreword
- Water supplies and testing
- Compliance with standards
- Learning from compliance failures
- Learning from events
- Consumer contacts
- Asset health
- Water safety planning and risk assessment
- Raw water
- Poly and perfluoroalkyl substances (PFAS)
- Audit programme
- Recommendations
- Enforcement
- SEMD
- NIS
- Materials in contact with drinking water (Regulation 31)
- Research publications
- Whistleblowers
- Working with stakeholders
- Annex A – Number of tests carried out by companies
- Annex B – Compliance with standards
- Annex C – Compliance failures and events
Consumer contacts
Acceptability of water
The acceptability of drinking water was ranked by consumers as their top priority and can be affected by several factors including its appearance, for example, discolouration or aeration, or the taste and/or odour. Most acceptability complaints are caused by a black, brown, or orange discoloration of water which are caused by raised concentrations of manganese, iron, and aluminium.
Whilst these metals are rarely at a concentration which is harmful to health, they can and do cause widespread rejection of water based upon appearance. The expectation and priority of a consumer is for their water to be clean and safe, and therefore, events which cause discolouration are highly disruptive to consumers with the inevitable drop in confidence which follows. The Inspectorate takes these events very seriously and many companies have regulation 28(4) notices in place to focus on the root causes of discolouration. In February 2024, the Inspectorate issued Information Letter 01-2024 Annual Provision of Information on Consumer Contacts, which set out new requirements for companies to report a greater level of detail on their consumer contacts which included the following additional requirements:
- A unique reference for each contact;
- Details of the district metered area the contact is located in;
- The date and time of the contact;
- The national grid reference (easting and northing) of the location of the contact;
- The mode of contact;
- Whether the contact is a repeat within a 12-month rolling period (that is a new occurrence or ‘case’ of a similar issue from the same consumer);
- and if the contact is associated with a notifiable event, and the event reference number associated with it.
Information regarding multiple contacts, for example if a consumer reports more than one drinking water quality concern during a contact, is also recorded.
The data submitted from companies in 2025, covering 2024 is the first submission to include this additional data, therefore direct year on year comparisons for the new data is not yet possible. To maintain continuation of a comparable data set and monitor industry performance and progress, only primary contacts and no event contacts have been used in the reporting of acceptability data for 2024.
In Wales in 2024 there were 9,950 consumer contacts regarding acceptability of drinking water, reported to companies wholly or mainly in Wales. This is a rate of 3.02 per 1,000 population. Table 8 shows the number of contacts received for each type of complaint for Welsh companies, with contacts relating to discoloured water (brown, orange, black) being the most common reason.
Table 8. Water quality complaints in Wales, 2024
| Category | Contacts |
|---|---|
| Appearance – Brown Black Orange | 5,624 |
| Taste / Odour – Other | 741 |
| Appearance – White Air | 733 |
| Taste / Odour – Chlorine | 533 |
| Drinking water quality concern – Lead and Analysis | 504 |
| Illness – Gastroenteritis | 377 |
| Appearance – Particles | 314 |
| DWQ Concern – Incident Related | 311 |
| Appearance – General Conditions | 209 |
| Taste Odour – Earthy Musty | 209 |
| Appearance – White Chalk | 134 |
| Illness – Skin | 76 |
| Appearance – Blue Green | 66 |
| Illness – Oral | 34 |
| Taste / Odour – Petrol Diesel | 28 |
| Illness – Medical Opinion | 26 |
| Appearance – Animalcules | 18 |
| Drinking water quality concern – Lifestyle | 9 |
| Drinking water quality concern – Pets Animals | 4 |
| Drinking water quality concern – Campaign | 0 |
Discoloured water
The Inspectorate reviews consumer contact data for discoloured water contacts on an annual basis. Companies whose performance is poorer than the industry average are investigated, and enforcement action taken where necessary. Dŵr Cymru Welsh Water has had a company-wide notice in place since 2022, with six individual zonal notices remaining from AMP7. Companywide discolouration performance is considered when serving notices, in addition to individual water supply zone performance. When completed, these legal instruments will improve water quality to consumers supplied in these areas.
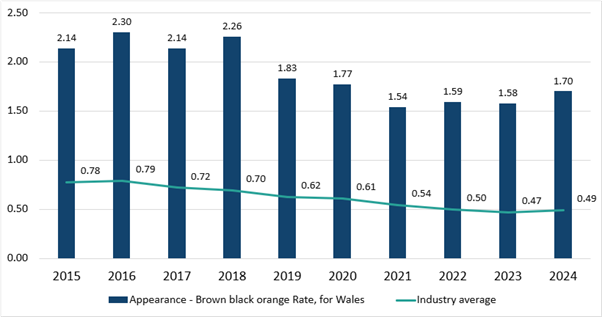
The number of contacts reporting discoloured water (brown, orange or black) across the industry (England and Wales) over recent years has been decreasing, however 2024 has seen a slight deterioration on the previous year’s performance (Figure 12). In Wales, the rate was also relatively stable, but has also seen a deterioration in 2024, from 1.58 contacts per 1,000 population in 2023 to 1.70 contacts per 1,000 population in 2024.
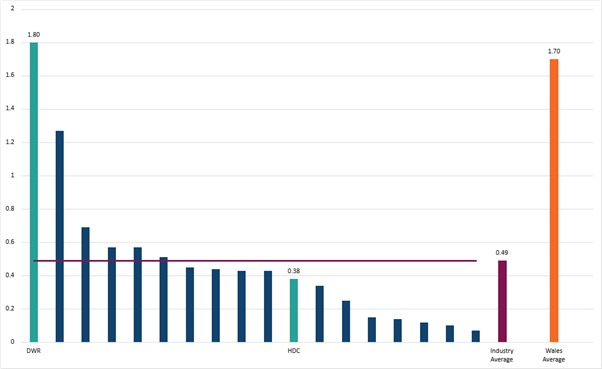
The 2024 rate of 1.7 per 1000 population in 2024 in Wales is significantly higher than the industry average of 0.49. Of those Welsh contacts, 98.56% are from consumers served by Dŵr Cymru Welsh Water, who remain the worst performing company in the industry for discolouration (Figure 13).
Figure 13 shows where the Welsh companies rank over the whole industry for discolouration contact performance in 2024.
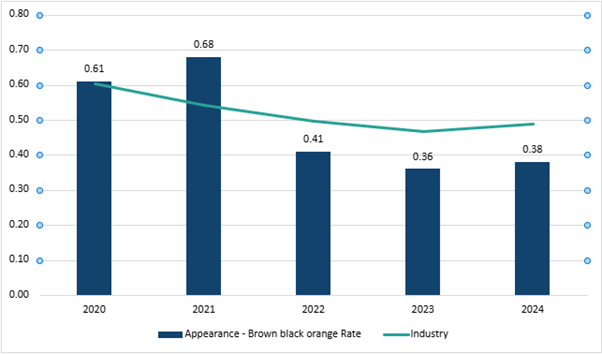
The contact rate for Hafren Dyfrdwy, which had been showing an improvement, has stalled in recent years (Figure 14). The company’s rate remains under the industry average.
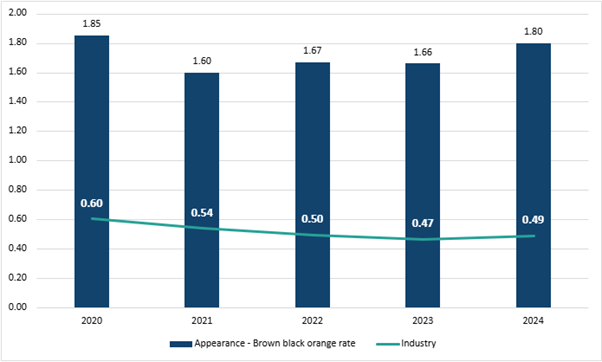
Dŵr Cymru Welsh Water remain an industry outlier and have seen a deterioration in performance in 2024. Dŵr Cymru Welsh Water had a number of zone-specific discolouration notices and a companywide notice for discolouration. Three of the zone-specific notices have been delayed into AMP8. The company-wide notice was served in 2022 with a target of 1.4 contacts per 1,000 population to be achieved by the end of AMP7. Figure 15 shows that the company fell short of this target. When there was an early indication that this target would not be met, the Inspectorate engaged with the company to better understand why the company believed this was the case by critically evaluating how the company determined its deliverables and the resulting impact. Part of this ongoing notice included setting a new target for the end of AMP8 using the same methodology as that for the AMP7 target. The company’s new target is 1.08 contacts per 1,000 population.
Taste and odour
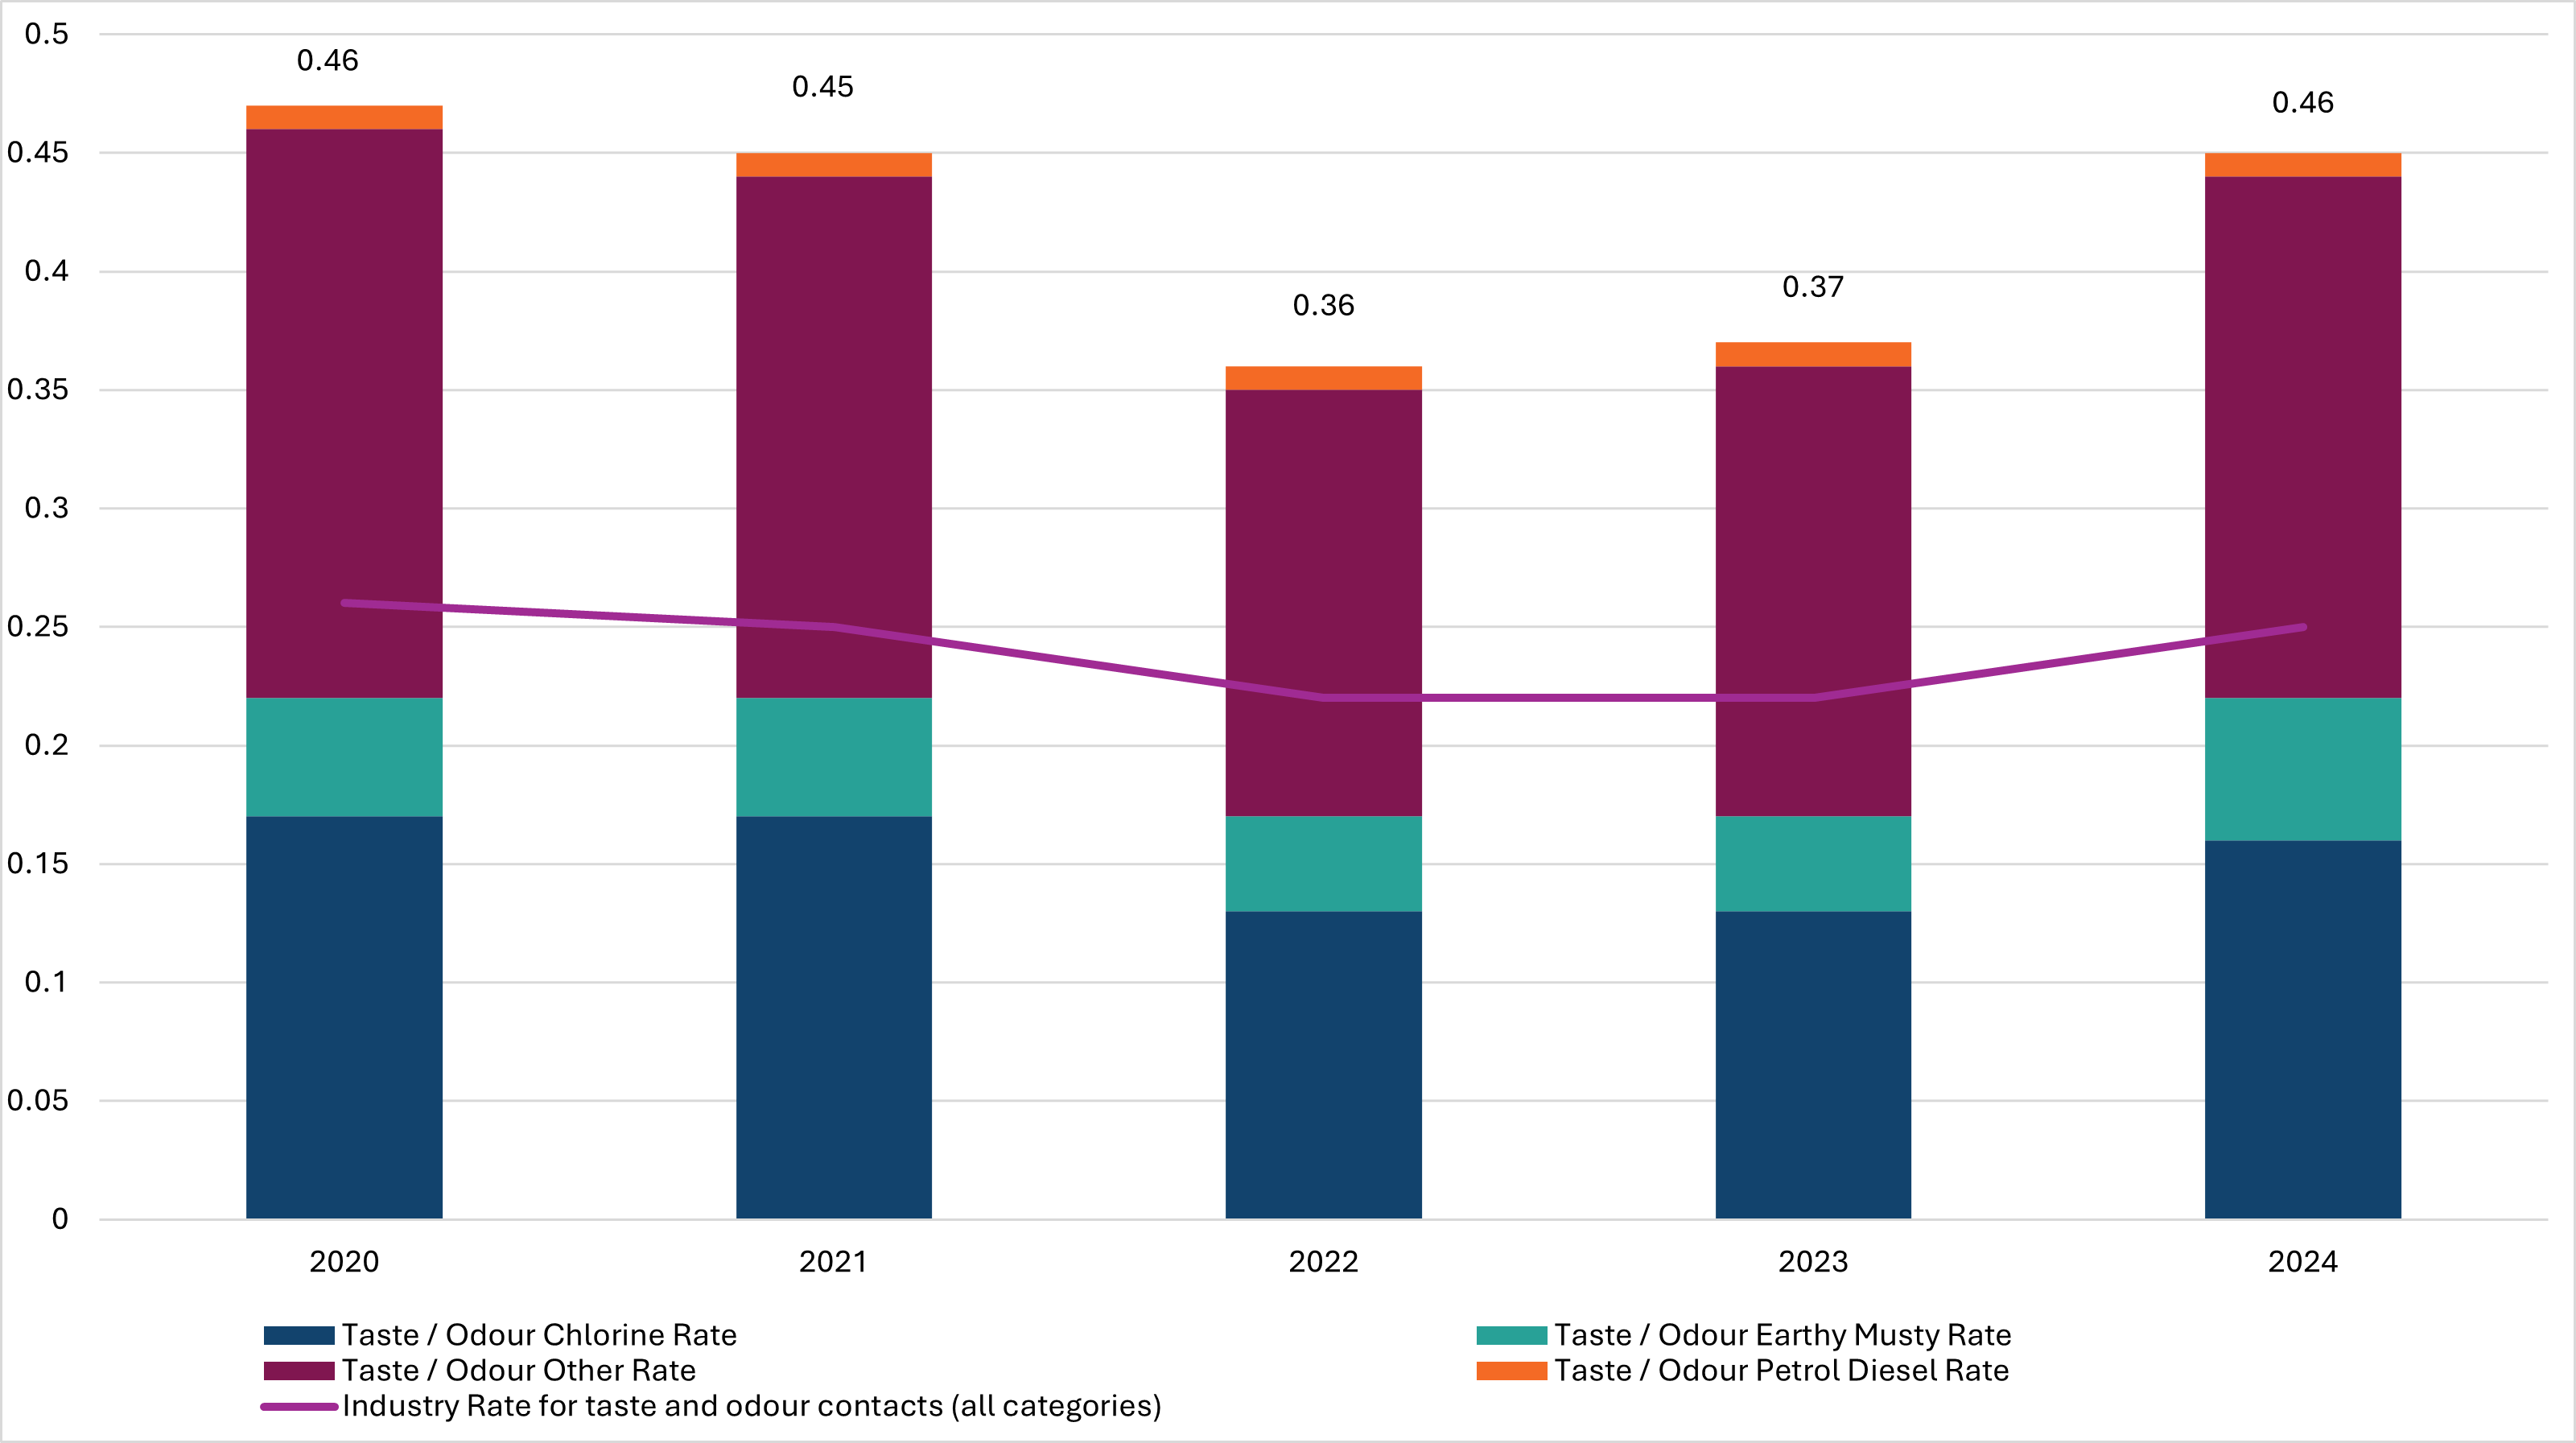
Similar to discoloured water contacts, the rate for total taste and odour contacts for the industry has gradually reduced year on year, although in 2024 this rate has worsened, to 0.25 per 1,000 population. In Wales, the rate is almost double the industry, at 0.46 in 2024 and is seen to be gradually increasing, from 0.36 in 2022.
The River Dee contamination event, which led to Hafren Dyfrdwy receiving a warning letter, also impacted United Utilities and Severn Trent Water at upstream locations. The source of the contamination was traced to a self-service milkshake bar on a farm, where an inadequate drainage system allowed 2-isopropyl-3-methoxypyrazine (IPMP) to enter the river.
Since IPMP is a food-grade compound, it did not activate the ‘Deepol’ system, leaving the responsibility of investigation and sampling to the abstracting water companies. The Inspectorate was notified of the contamination through the water quality event notification process.
United Utilities customers experienced the greatest impact, with the company receiving 968 consumer complaints between 5 and 31 August 2024, 786 of which were related to taste and odour issues. Learning from these events in England can be found in Drinking Water 2024 England.
Events contacts
With the additional consumer contact information available to the Inspectorate for 2024, the number and category of event-related contacts have been reviewed. Although these contacts do not feed into the contact rates for each company or the industry as a whole, they provide valuable insight into the location and volume of these reports. Understanding these patterns helps identify potential hotspots and background levels of contacts, enabling improved oversight.
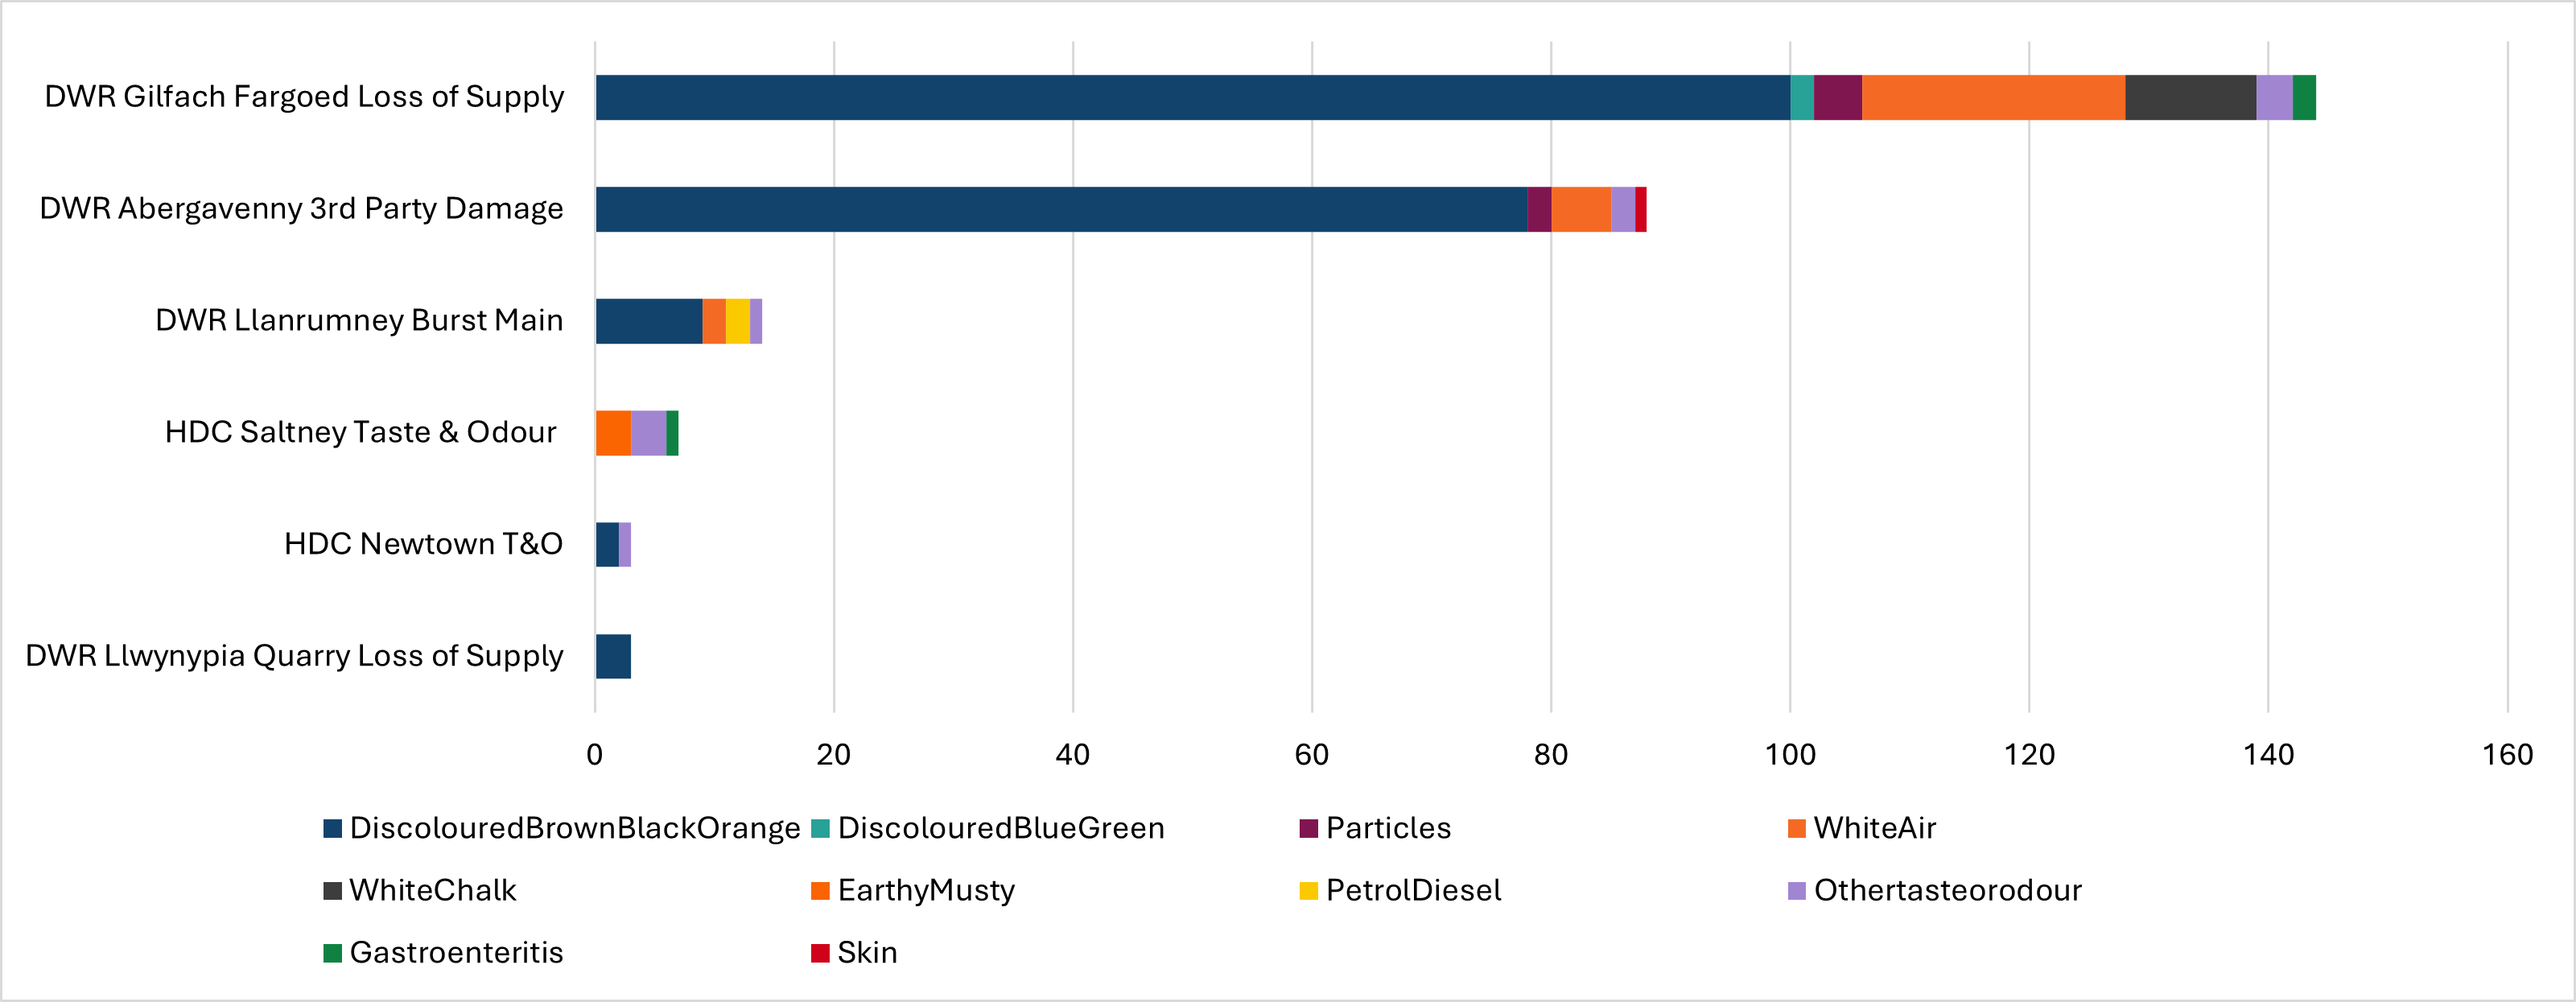
In Wales, there were six events which generated discoloured water contacts, as can been seen in Figure 17. Two of these events, Gilfach Fargoed loss of supply and Abergavenny third party damage, are amongst the top 10 events in the industry for discoloured water contacts.

